
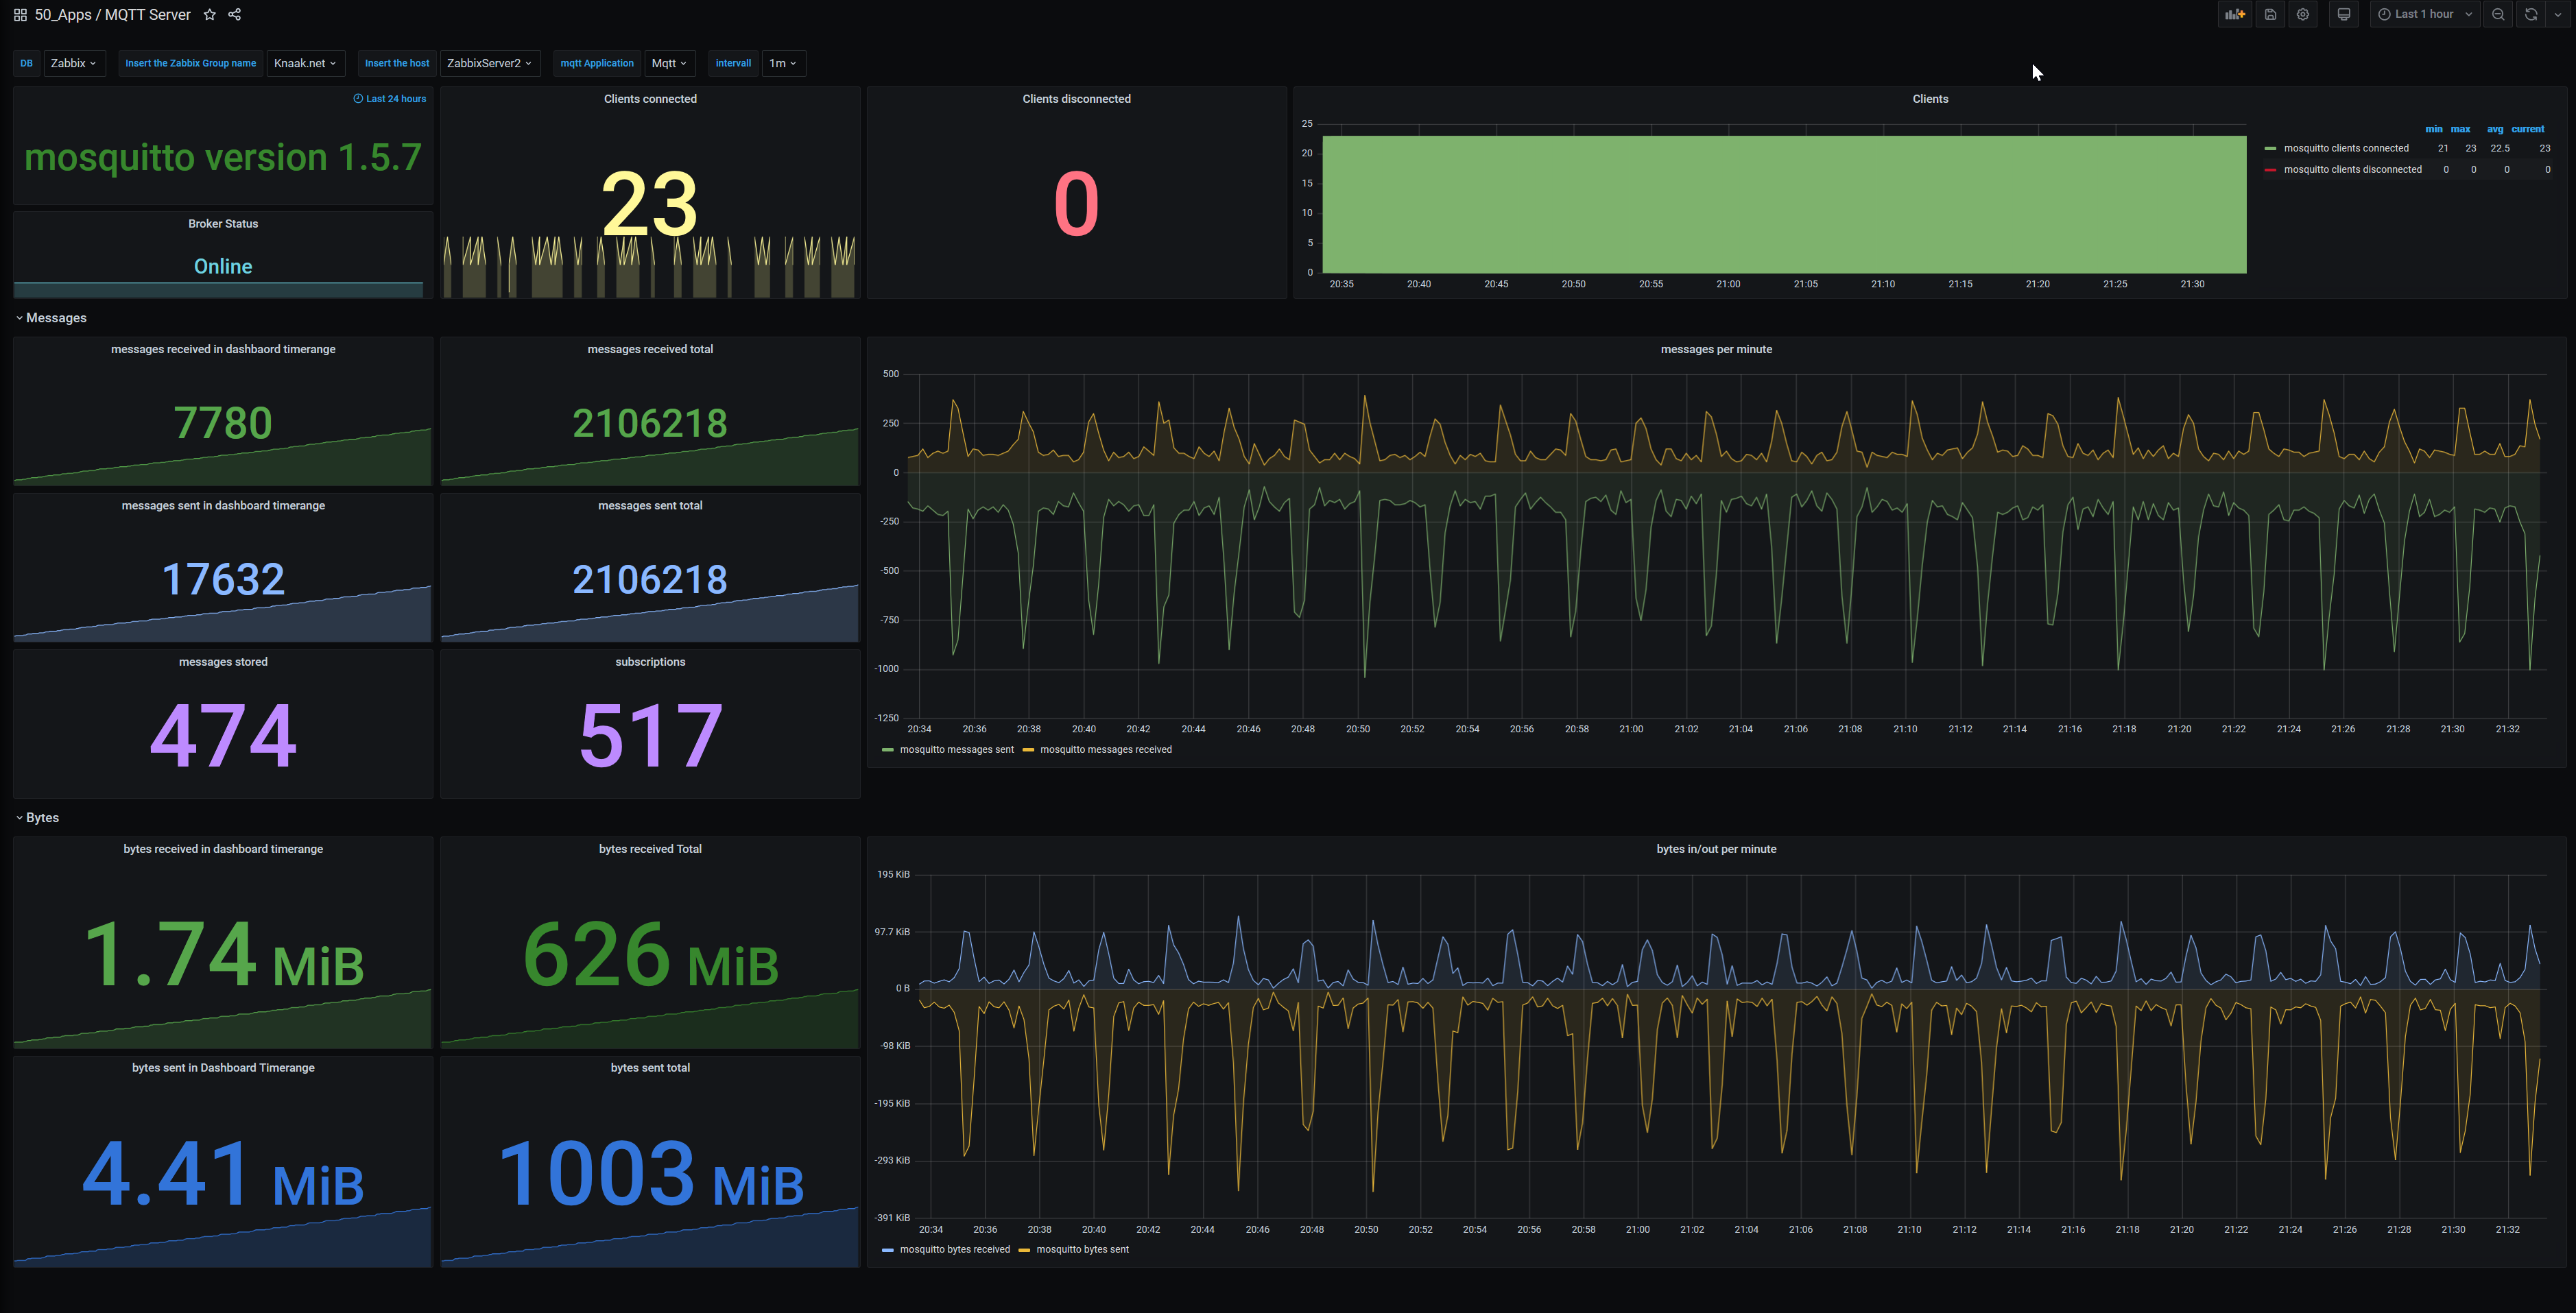
- 20 Zabbix Items
- 1 Zabbix Trigger
- 4 Zabbix Graphs
- 1 Zabbix Dashboard
- 1 Grafana Dashbaord
- $SYS/broker/load/bytes/received: The total number of bytes received since the broker started.
- $SYS/broker/load/bytes/sent: The total number of bytes sent since the broker started.
- $SYS/broker/clients/connected: The number of currently connected clients
- $SYS/broker/clients/disconnected: The total number of persistent clients (with clean session disabled) that are registered at the broker but are currently disconnected.
- $SYS/broker/clients/maximum: The maximum number of active clients that have been connected to the broker. This is only calculated when the $SYS topic tree is updated, so short lived client connections may not be counted.
- $SYS/broker/clients/total: The total number of connected and disconnected clients with a persistent session currently connected and registered on the broker.
- $SYS/broker/messages/received: The total number of messages of any type received since the broker started.
- $SYS/broker/messages/sent: The total number of messages of any type sent since the broker started.
- $SYS/broker/messages/publish/dropped: The total number of publish messages that have been dropped due to inflight/queuing limits.
- $SYS/broker/messages/publish/received: The total number of PUBLISH messages received since the broker started.
- $SYS/broker/messages/publish/sent: The total number of PUBLISH messages sent since the broker started.
- $SYS/broker/messages/retained/count: The total number of retained messages active on the broker.
- $SYS/broker/subscriptions/count: The total number of subscriptions active on the broker.
- $SYS/broker/time: The current time on the server.
- $SYS/broker/uptime: The amount of time in seconds the broker has been online.
- $SYS/broker/version: The version of the broker. Static.
- $SYS/broker/messages/stored: The number of messages currently held in the message store. This includes retained messages and messages queued for durable clients.
- mosquitto server (not testet with other brokers)
- Zabbix Server 5.2
- Zabbix Agent 2 active
- Zabbix Agent 2 MQTT plugin. - This plugin provides a native solution for monitoring messages published by MQTT brokers. The plugin can monitor several broker instances simultaneously via Zabbix agent 2. Proxy and websocket connections are supported. The plugin keeps all subscriptions to a single broker in one connection to reduce network strain. The plugin supports active checks only. https://git.zabbix.com/projects/ZBX/repos/zabbix/browse/src/go/plugins/mqtt?at=refs%2Fheads%2Frelease%2F5.2
you can use this template with any zabbix agent2 and a zabbix server >5.2. Download the template you like (yaml,josn,xml). There all the same content.
Install the template and Inherited the template macros. Insert the macro data, like broker ip.
-
{$MQTTBROKER} - Broker URI like tcp://host:1883
Examples
- localhost
- tcp://host:1883
- tcp://host:1883
- tcp://host:1883
- ws://host:8080
- tls://host:8883
-
{$MQTTBROKERIP} - 192.168.x.x (for TCP check)
-
{$MQTTBROKERPORT} - 1833 (for TCP check)
-
{$MQTTPASSWORD} - pw string
-
{$MQTTUSER} - username string
The plugin uses broker URI, topic, username and password from item key parameters. The first two parameters broker and topic, broker URI can be empty, but the topic parameter is mandatory. The last two parameters username and password need to be provided only if required.
Websocket connection is supported using "ws://" scheme.
If the Zabbix agent 2 is running behind a http/https proxy then the following environment variables are used 'TP_PROXY', 'HTTPS_PROXY' and 'NO_PROXY', when this plugin establishes a connection.
TLS encryption certificates can be used, by saving them in default locations. For example in ubuntu it is "/etc/ssl/certs/" directory. For TLS use "tls://" scheme
If broker URI is left empty the default value of "localhost" is used. If broker URI does not contain a scheme the default value of "tcp://" is used. If broker URI does not contain a port the default value of "1883" is used.
The topic may contain wildcards ("+","#"). If the topic contains a wildcard the response will be a json containing the topic and value. https://git.zabbix.com/projects/ZBX/repos/zabbix/browse/src/go/plugins/mqtt?at=refs%2Fheads%2Frelease%2F5.2
Download Grafana Dashboard https://grafana.com/grafana/dashboards/14186 https://github.com/corgan2222/zbx_template_mqtt_server/tree/main/grafana
import the JSON Model and choose your zabbix database change the variables if needed.
The plugin uses Zabbix agent 2 logs. To receive more detailed information about logged events, consider increasing a debug level of Zabbix agent 2.
from: https://www.hivemq.com/blog/why-you-shouldnt-use-sys-topics-for-monitoring/
SYS-Topics for Production Monitoring
Although SYS-Topics have use-cases for development and debugging, SYS-Topics are not suitable for monitoring broker instances in production. If you need to rely on the availability guarantees of your MQTT broker, use an actual monitoring system, SYS-Topics do not replace monitoring applications.
We highly recommend that you disable SYS-Topics completely for production systems and use the available monitoring interfaces, e.g. Graphite or JMX.
5 reasons SYS-Topics are not suitable for production monitoring:
The metric publishing interval for most MQTT brokers is 60 seconds by default. Monitoring interfaces like JMX allow to poll the most current data whenever needed. So the broker does not dictate the monitoring system how the resolution should be. The monitoring system can decide how often new data should be collected, without modifying any configuration on the MQTT broker.
While the metrics provided by SYS-Topics can be useful, they are only a small subset of all available metrics. For example, HiveMQ exposes more than 100 different metrics (the number of exposed metrics also increase with every release). The SYS-Topic Metrics usually are more focused on MQTT session monitoring and thus don’t provide metrics that can give you an overview of the brokers health at a quick glance. The most interesting metrics for operation teams are usually product dependant, so it’s unlikely that a common SYS-Topic standard will cover these in the future.
To make it more difficult for an attacker to use exploits that target a specific software version, it is a common best practice to conceal the actual software version that is used in a deployment. Frequently, you also want to hide the actual software that is used from attackers. While you should never rely on ‘Security by Obscurity’ as your primary security measure, it’s still important to hide this deployment information. SYS-Topics expose key information such as the Broker Software Used and the Version Number to every subscriber. This information can be valuable for attackers but is seldom useful to legitimate subscribers.
If someone wants to build a custom monitoring solution based on SYS-Topics, MQTT connections to all cluster nodes need to be established. Typically MQTT clusters are behind a load balancer, so often it’s not even possible to connect to a specific cluster node. Monitoring integrations such as Graphite are built with clustering in mind and so it’s easy to get a quick health overview of the whole cluster. That’s much harder to achieve with SYS-Topics.
A good monitoring practice is to use a dedicated monitoring channel instead of using the same channel you are monitoring. With MQTT brokers, this means that if you are monitoring the MQTT communication, you shouldn’t use MQTT (SYS-Topics) to monitor the MQTT communication. It’s the same as: Don’t use e-mail alerts for monitoring e-mail servers. If the MQTT communication is not available for any reason, you won’t get any monitoring data. The monitoring data may be most valuable especially when unexpected occurs. If you rely on this data for the alert, you may have a problem. If you’re using a dedicated monitoring channel such as JMX, Graphite, or Nagios, a problem with the MQTT communication should not affect your monitoring.
Stefan Knaak – stefan@knaak.org